Home
Weather Dublin
WeatherRadar
RainfallRadar
TemperatureRadar
WindRadar
LightningRadar
Weather News
Editor's Pick
Discover the app
Weather widget
Contact us
Apps
    Home / Editor's Pick /

    Heading over 40°C? Long-term trends need a pinch of salt

13:09
21 July 2026

Heading over 40°C?
Long-term trends need a pinch of salt

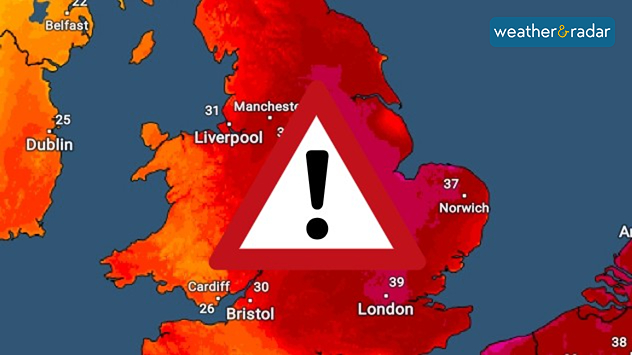
Temperature map of England showing widespread extreme heat, with temperatures reaching 39°C near London, 37°C near Norwich, and over 30°C across much of the country, alongside a large warning symbol indicating dangerous conditions.
Another heatwave is likely, but hitting 40°C is less so.

Once again, weather models are being posted online showing widespread regions of the UK passing 40°C at the start of August, and once again these need some extra context.

While some reports are writing of the next severe heatwave, it is unlikely to be exactly what is currently stated. Beyond three to five days it gets incredibly difficult to pinpoint specific weather conditions. So, posts suggesting highs of 40 or 41 °C around August 1st should be approached with caution.

What is actually happening? These posts are using one extreme output of one weather model. Beyond the five day mark a forecast is no longer possible, only a trend of where conditions are roughly expected to reach.

London

Tu
16
23
We
16
26
Th
16
25
Fr
18
28
Sa
17
26
Su
17
22
Mo
17
26
Tu
17
27
We
17
27
Th
17
28
Fr
18
29
Sa
17
26
Su
17
28
Mo
18
29
Max (°C)
Min (°C)
moreless

Manchester

Tu
13
23
We
15
23
Th
16
22
Fr
13
21
Sa
14
19
Su
15
18
Mo
14
21
Tu
14
22
We
14
22
Th
14
22
Fr
14
22
Sa
14
22
Su
13
22
Mo
14
23
Max (°C)
Min (°C)
moreless

Dublin

Tu
14
20
We
14
20
Th
14
20
Fr
12
23
Sa
16
19
Su
14
19
Mo
13
21
Tu
12
21
We
12
20
Th
11
20
Fr
12
21
Sa
12
20
Su
12
20
Mo
13
21
Max (°C)
Min (°C)
moreless

Edinburgh

Tu
11
24
We
13
22
Th
13
21
Fr
14
20
Sa
15
18
Su
13
17
Mo
13
21
Tu
13
21
We
14
20
Th
13
22
Fr
12
20
Sa
12
20
Su
13
21
Mo
13
21
Max (°C)
Min (°C)
moreless

Cardiff

Tu
16
26
We
14
25
Th
15
26
Fr
14
25
Sa
14
21
Su
17
22
Mo
16
24
Tu
15
23
We
15
23
Th
14
23
Fr
15
23
Sa
16
24
Su
14
22
Mo
15
23
Max (°C)
Min (°C)
moreless

The particular 40°C+ claim on August 1st is an extreme scenario which is unlikely. If several model runs point in this direction, it becomes more reliable. This is not the case currently.

At this point we know that we are likely to see another hot spell, very likely becoming the fourth heatwave of the season, but we do not yet know how hot it will be.

Forecast vs trend

Forecasts focus on specific conditions in the short-term, usually accurate up to five days. Trends use data and probabilities to determine a more general outlook for a longer timeframe without details.

Trends are updated regularly with new data, and can change many times before we get to the dates mentioned.

It is best to remember that the details will only become clear as we get closer to the date. Keep an eye on the 14 day weather card and the TemperatureRadar in the meantime.

Ryan Hathaway
More on the topic
Violent storms impacting northern Italy. Hail and storm damage. . . Thursday 16 July 2026
A weather map showing thunderstorms over northern Italy and a photograph of large hailstones in a hand.
Thursday 16 July 2026

Hail and storm damage

Violent storms impacting northern Italy
Sweltering heat in Sardinia. Up to 47°C. . . Saturday 18 July 2026
A temperature map of Sardinia shows temperatures ranging from 38 to 46 degrees.
Saturday 18 July 2026

Up to 47°C

Sweltering heat in Sardinia
Wildfires break out amid ongoing drought. Water restrictions active. . . Tuesday 14 July 2026
Smoke rising from a scorched moorland hillside after a wildfire, with blackened vegetation, smouldering ground, and drifting gray smoke covering the burned landscape.
Tuesday 14 July 2026

Water restrictions active

Wildfires break out amid ongoing drought
All weather news
This might also interest you
Super Typhoon Bavi threatens Taiwan. Up to 1,000 mm of rain. . Weather Videos. Wednesday 8 July 2026
The image shows an intense tropical cyclone over the western Pacific, east of Taiwan and the Philippines. The centre of the system is depicted as a light purple and white vortex with a clearly visible eye, surrounded by a ring of red and orange areas indicating the strongest wind speeds. A white arrow marks the typhoon’s predicted track towards the north-west, in the direction of Taiwan. To the west of the storm lie the Philippines, with the cities of Manila and Cebu; to the north of these lies Taiwan, with Taipei. Further west, the Chinese coast, including Hong Kong, and parts of Vietnam can be seen. The coloured wind map shows predominantly green areas outside the storm’s core, indicating significantly weaker winds. White streamlines illustrate the typhoon’s anti-clockwise circulation in the Northern Hemisphere. The highest wind speeds are concentrated around the eye of the cyclone.
Weather VideosWednesday 8 July 2026

Up to 1,000 mm of rain

Super Typhoon Bavi threatens Taiwan
Historic Storm Éowyn arrives. On this day.... . . Saturday 24 January 2026
Split image showing a person in a yellow jacket struggling against strong winds and heavy rain on a street at night on the left, and an Irish wind forecast map on the right with red and purple shading, gusts up to 75 mph, and a wind warning icon, divided by a curved white line.
Saturday 24 January 2026

On this day...

Historic Storm Éowyn arrives
Seasonal warmth between spring thunder. Your weather - Your shots. . . Sunday 19 April 2026
Split image showing coastal sunset with layered lenticular clouds over rooftops and palm trees on the left, and a green valley with river and hills under soft daylight on the right.
Sunday 19 April 2026

Your weather - Your shots

Seasonal warmth between spring thunder
All articles
Weather & Radar

Weather & Radar is also available on

Google Play StoreApp Store

Company

Contact us Privacy Policy Legal info Accessibility statement

Services

Uploader

Socials

facebooktwitteryouTubelinkList